
Shade and light analysis for golf course greens
Every superintendent knows which greens are struggling. Few can prove why. A shade and light analysis maps the whole course by drone and models the light every green gets through the seasons, so you can see which greens fall short for your grass, which trees cost them the most light, and how closed-in each green is to air movement.

Watch the shade move across a course from sunrise to sunset.
Who uses a shade analysis?
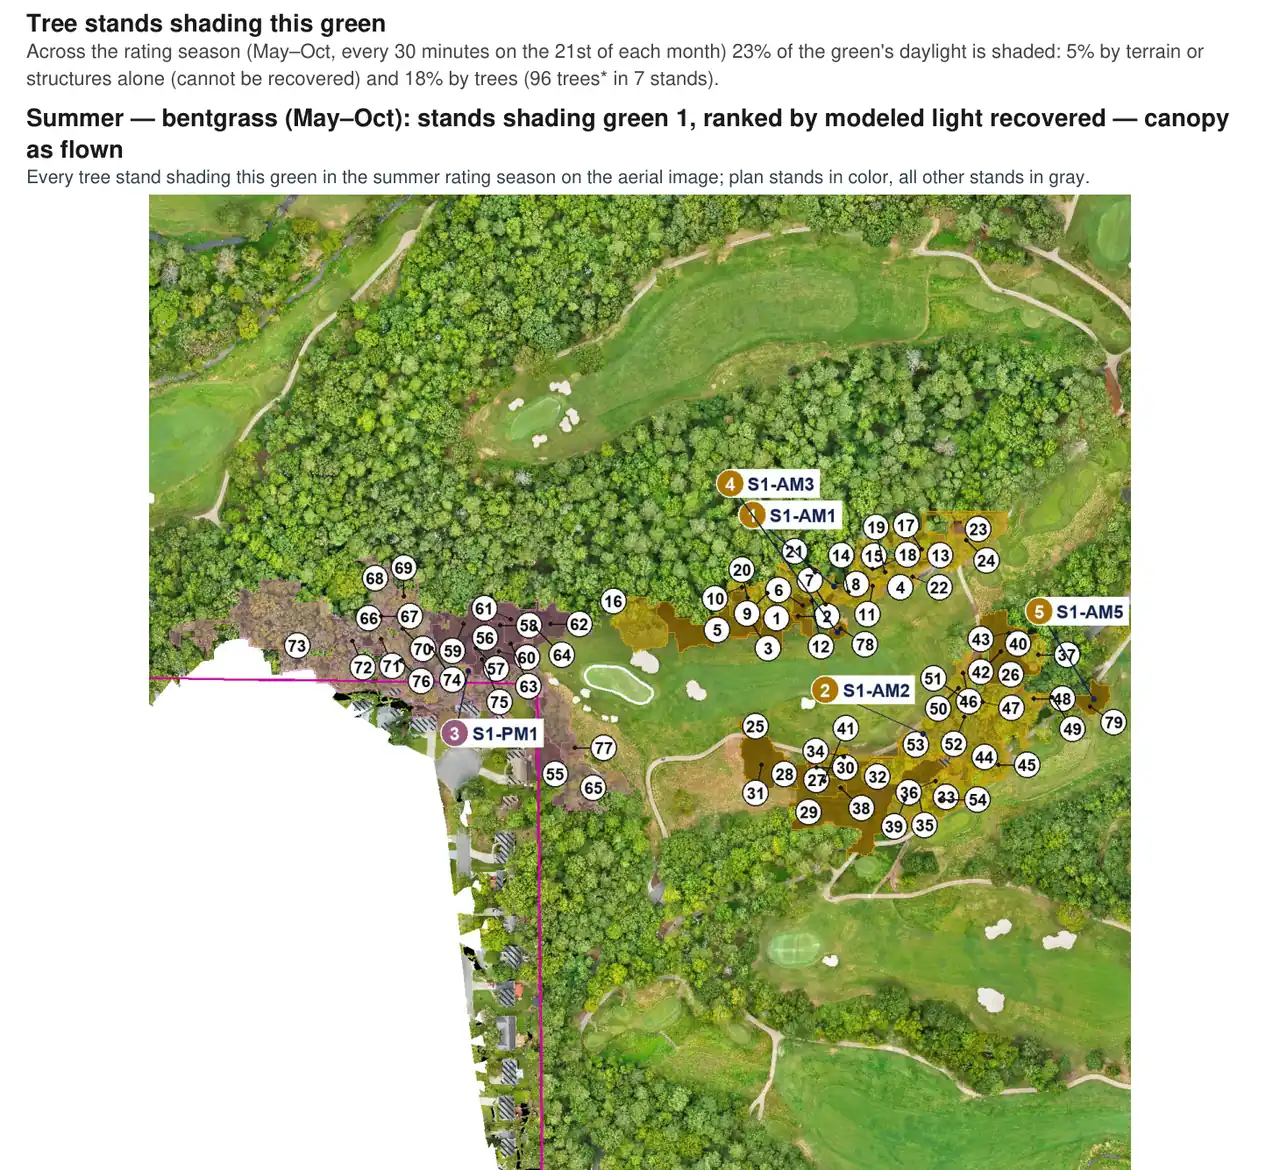
See which greens are short on light, in which season, and which trees are taking it. Every green gets its own page: light by month, the stands that shade it, morning versus afternoon shade, and how much light would return if a stand were cleared or thinned. Take data to your green committee instead of an opinion.
Tree work is expensive and it's political. The executive summary gives the board one page: which greens have enough light, which are borderline, which could get there if specific stands were cleared, and which are limited by terrain or buildings. Every number comes from a survey of your course, so the decision rests on data.
What the analysis delivers.
Executive summary
One page per grass: which greens are adequate, borderline, can reach adequate light with tree work, or are limited by terrain and structures.
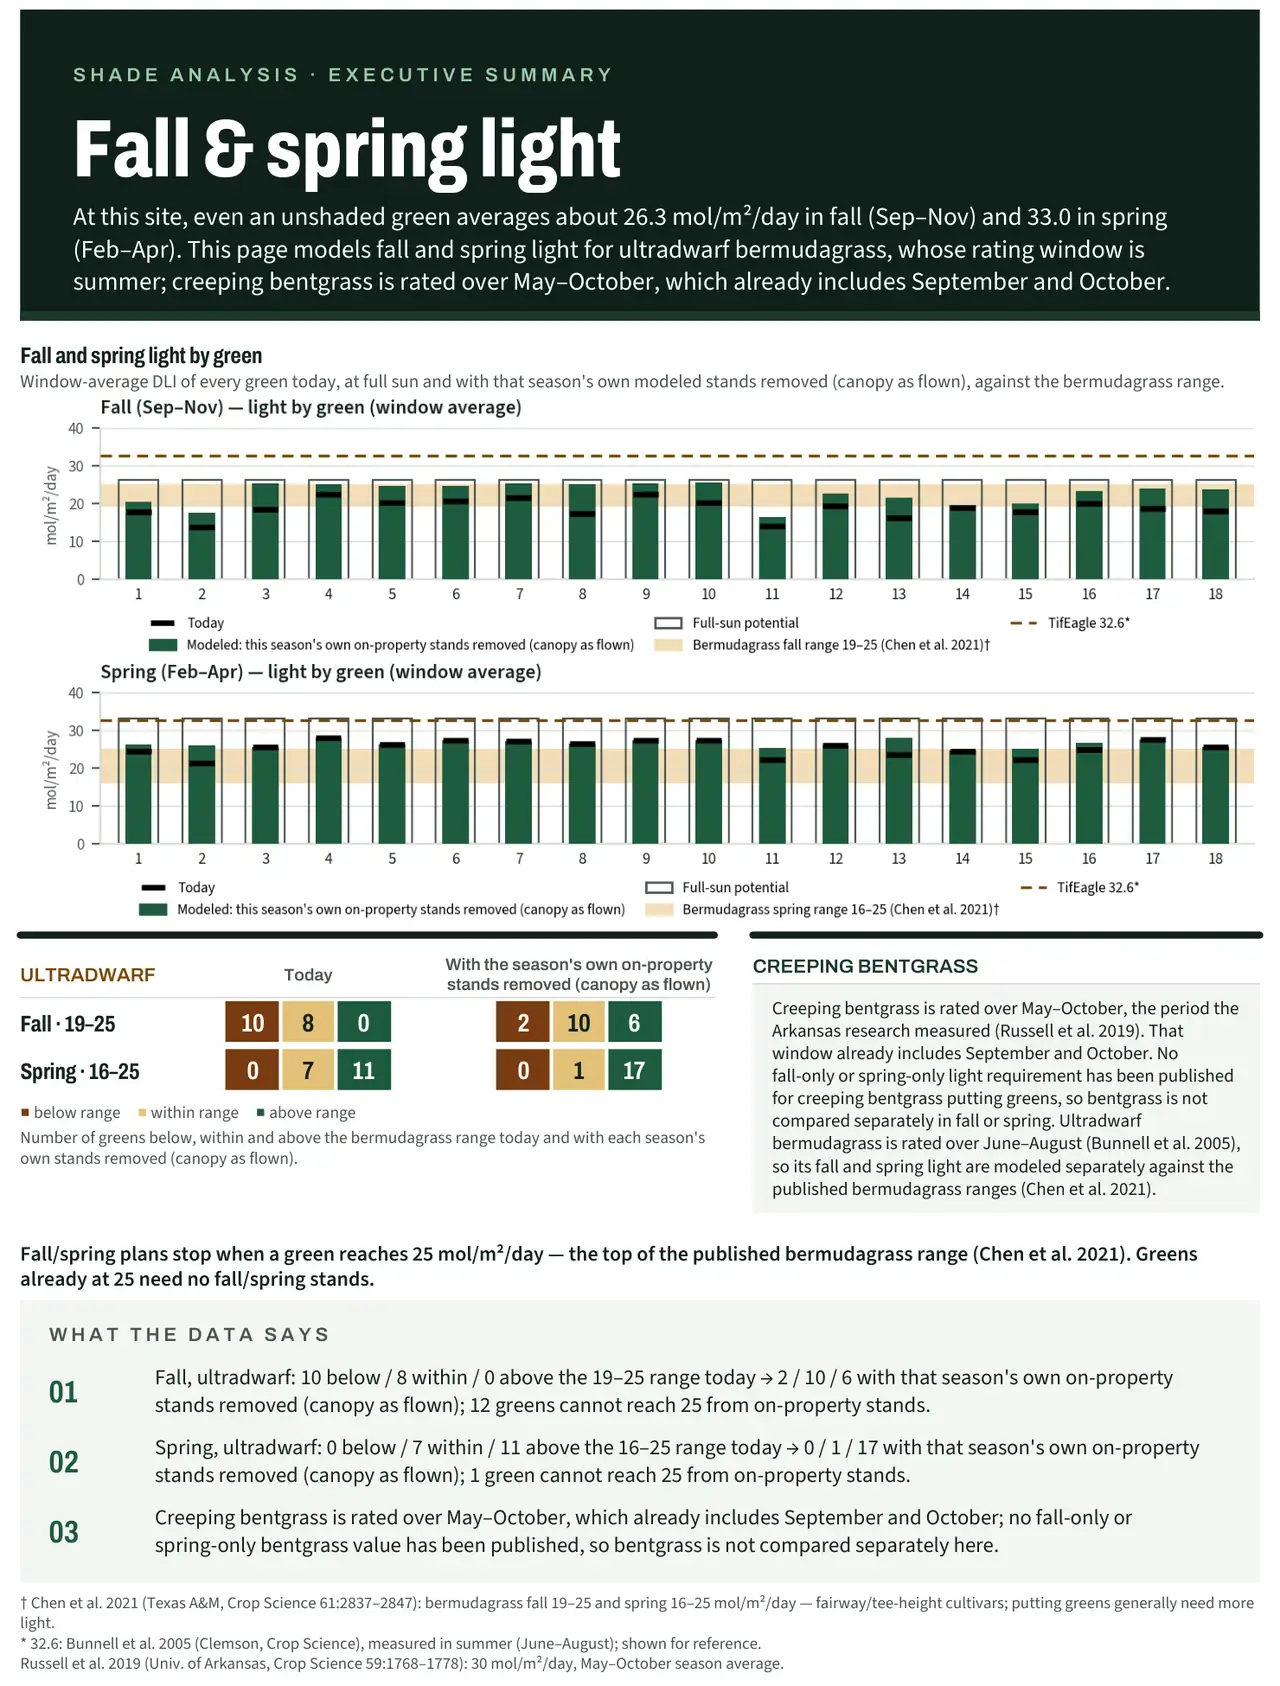
Analytics report
Every green in detail: light by month, sun-hours maps, the stands that shade it, and modeled light if each stand were cleared or thinned.
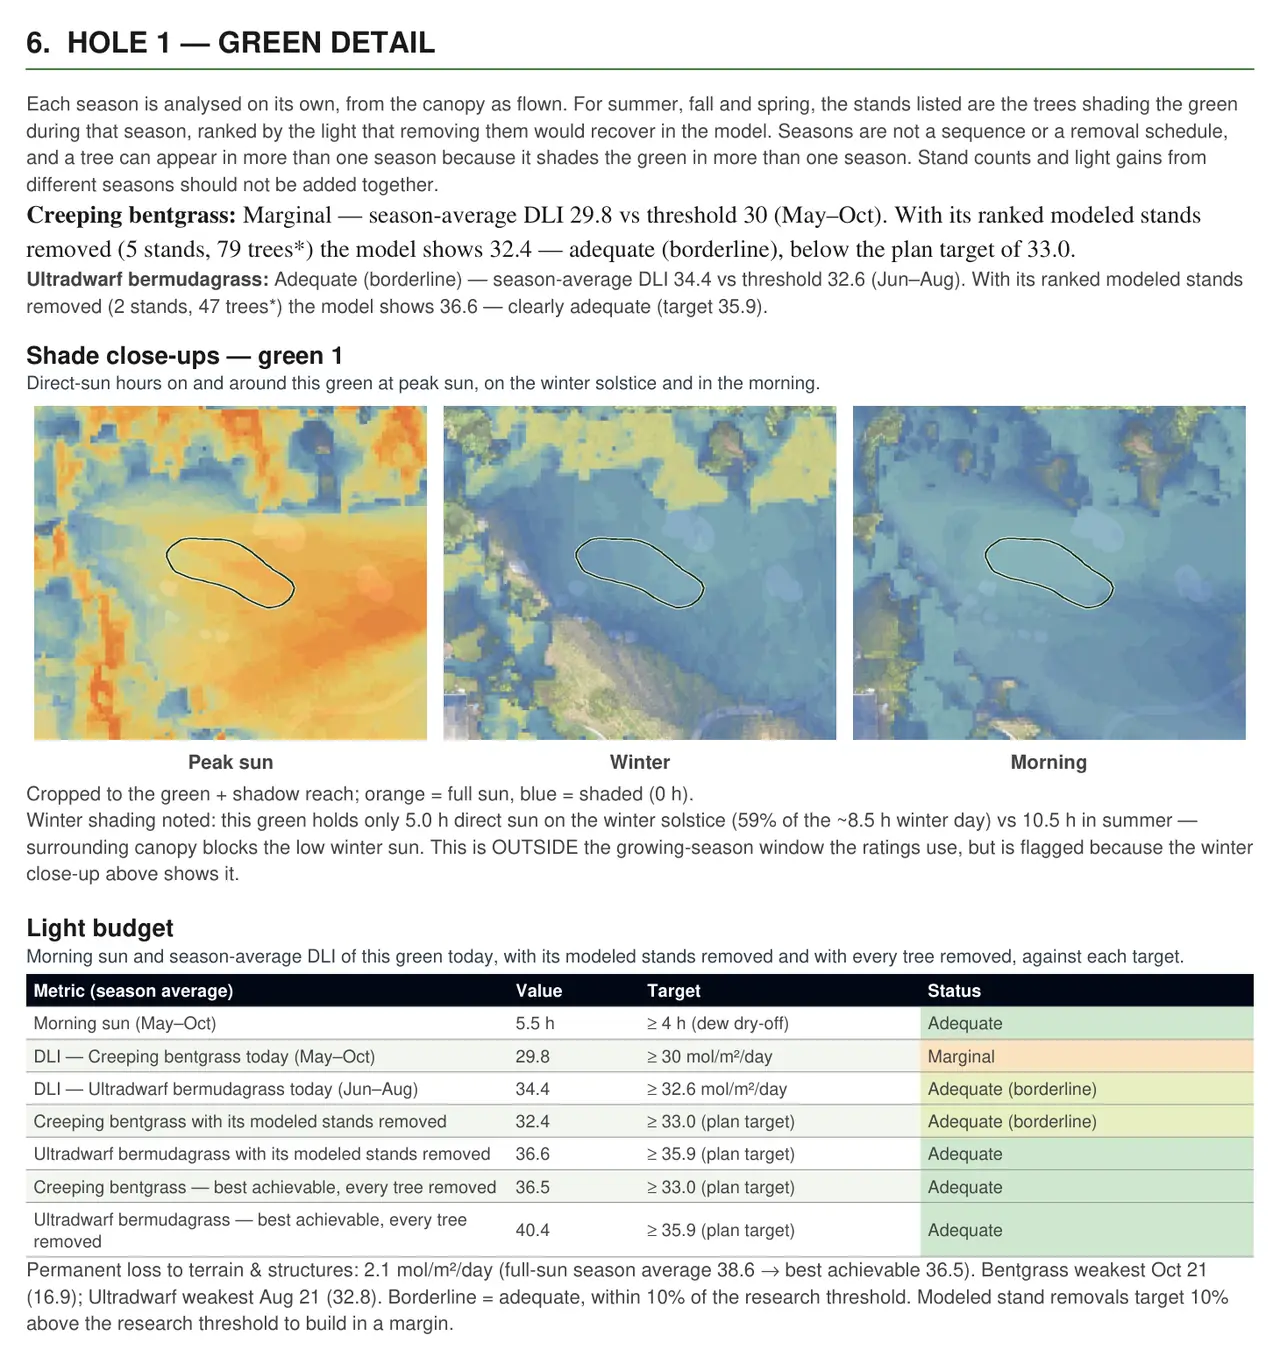
Field guide
A pocket guide for walking the course with your crew or arborist: each green's shading stands marked on the map.
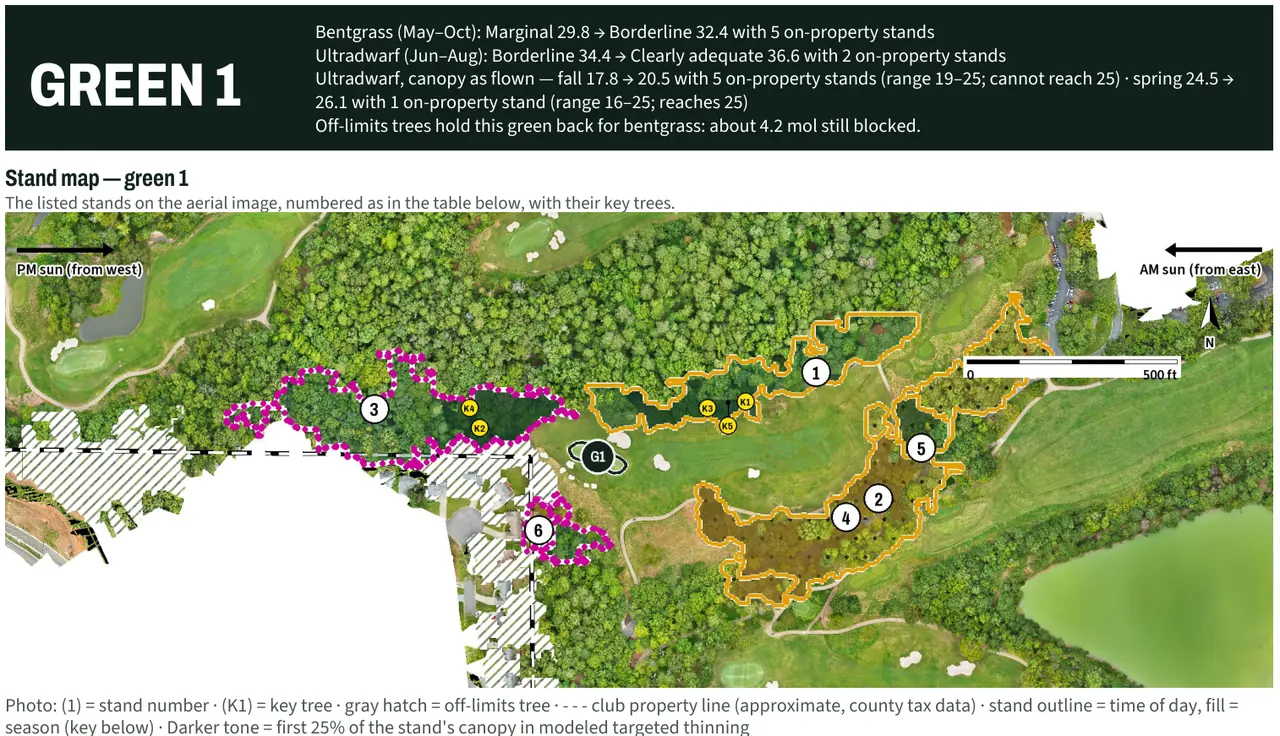
Atlas shade maps
Course-wide sun-hours and seasonal light maps on your Atlas base map.
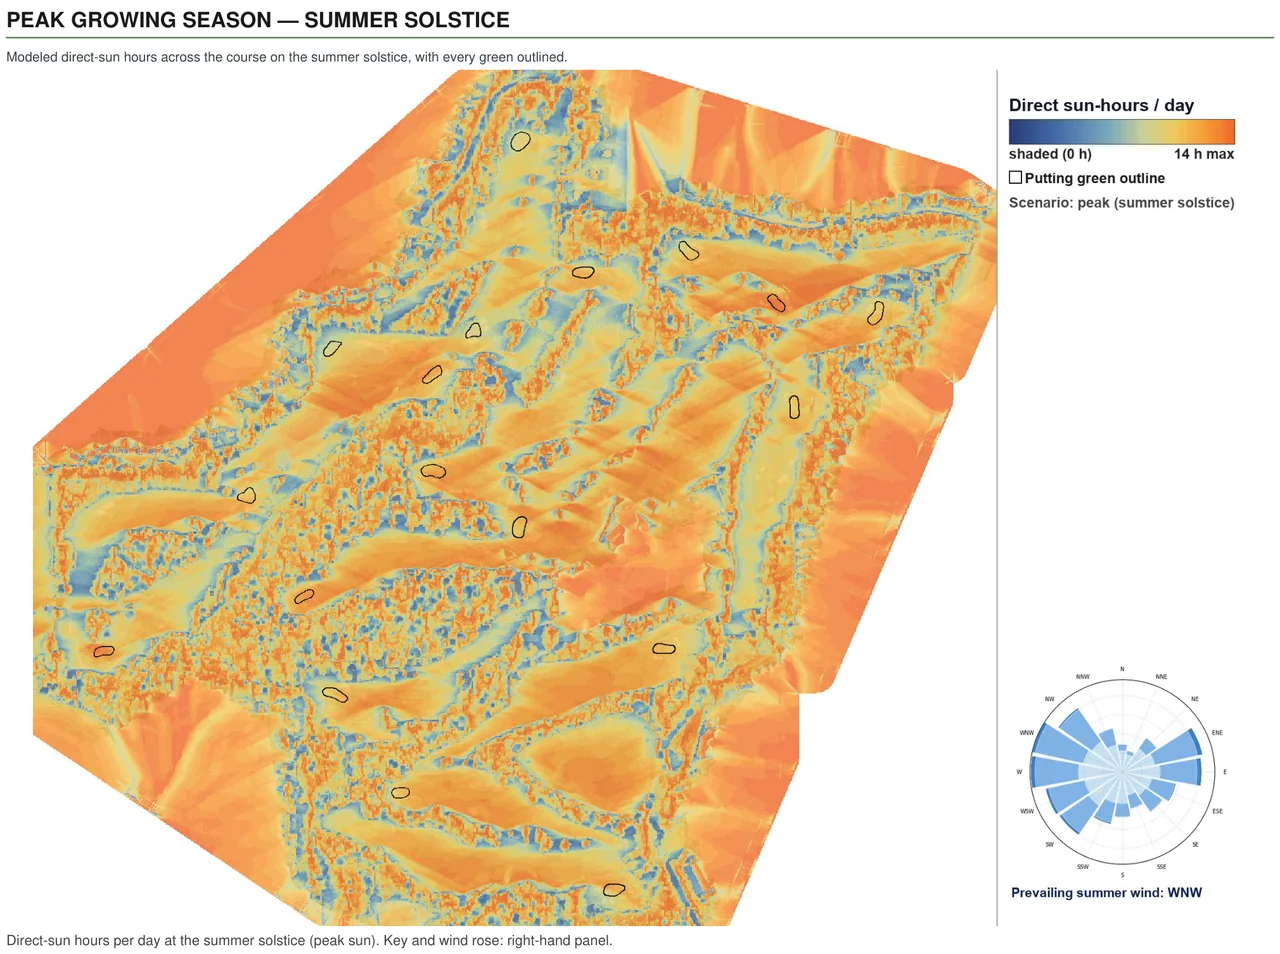
Grass-conversion ratings
Each green rated for creeping bentgrass and ultradwarf bermudagrass side by side, so you know what a conversion would face before you commit.
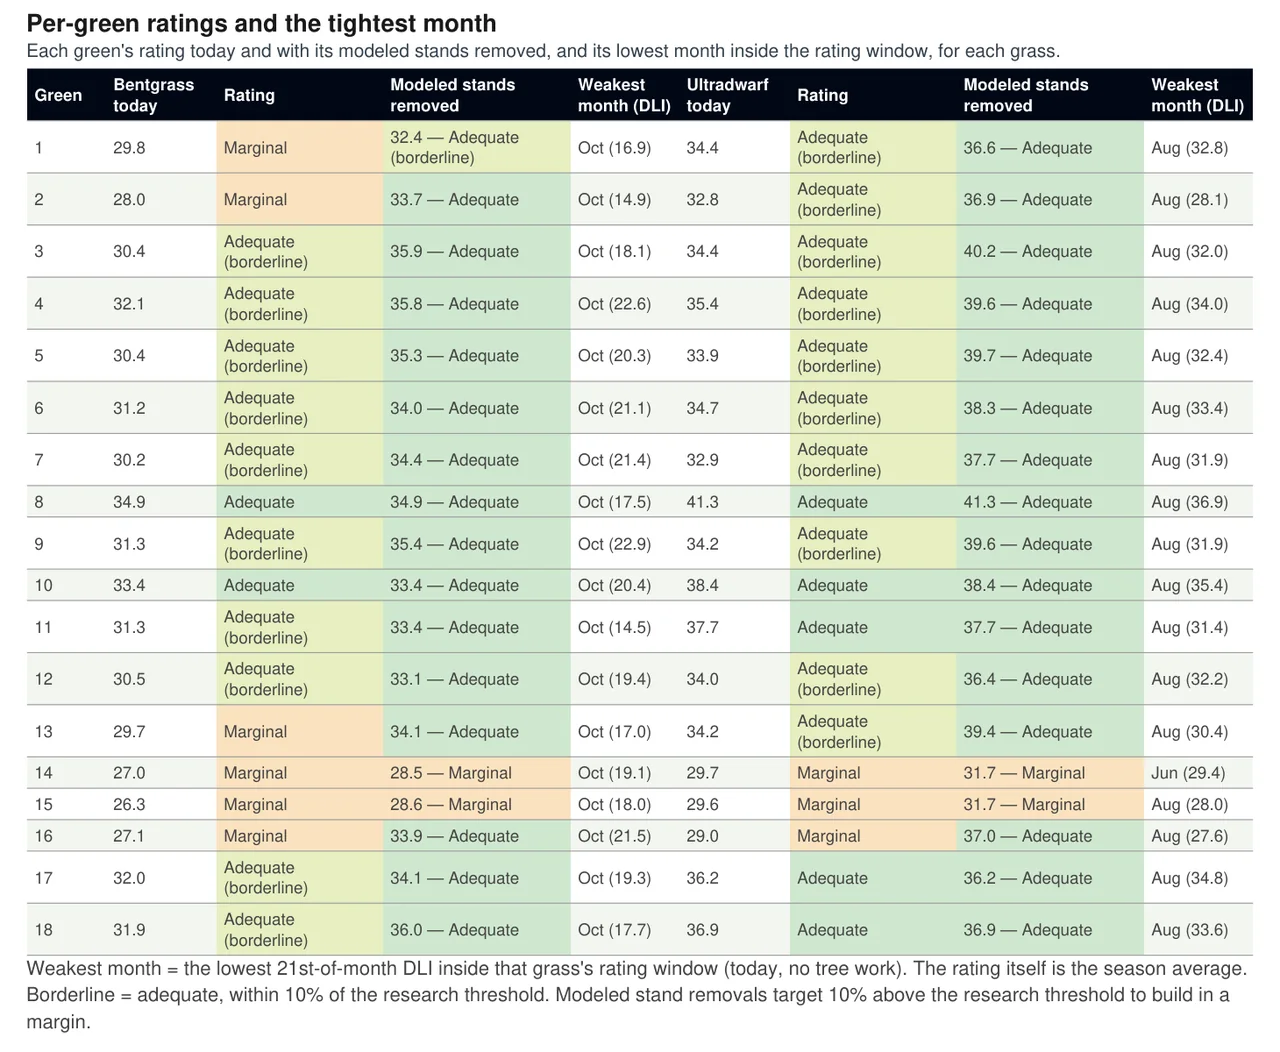
More pages from a client report.
On a client course, the modeled season light rated 16 of 18 greens Adequate for creeping bentgrass (May–October, against 30 mol/m²/day), and two more Adequate but borderline, within ten percent of the line. For ultradwarf bermudagrass (June–August, against 32.6 mol/m²/day), all 18 rated Adequate.
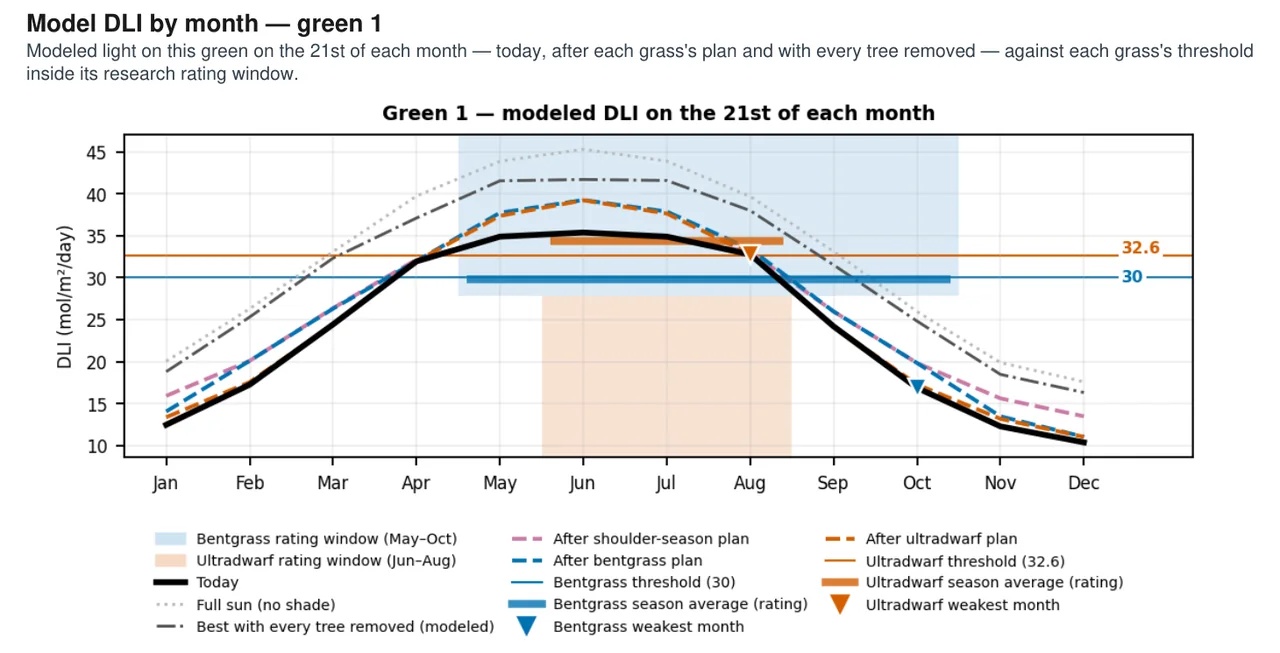
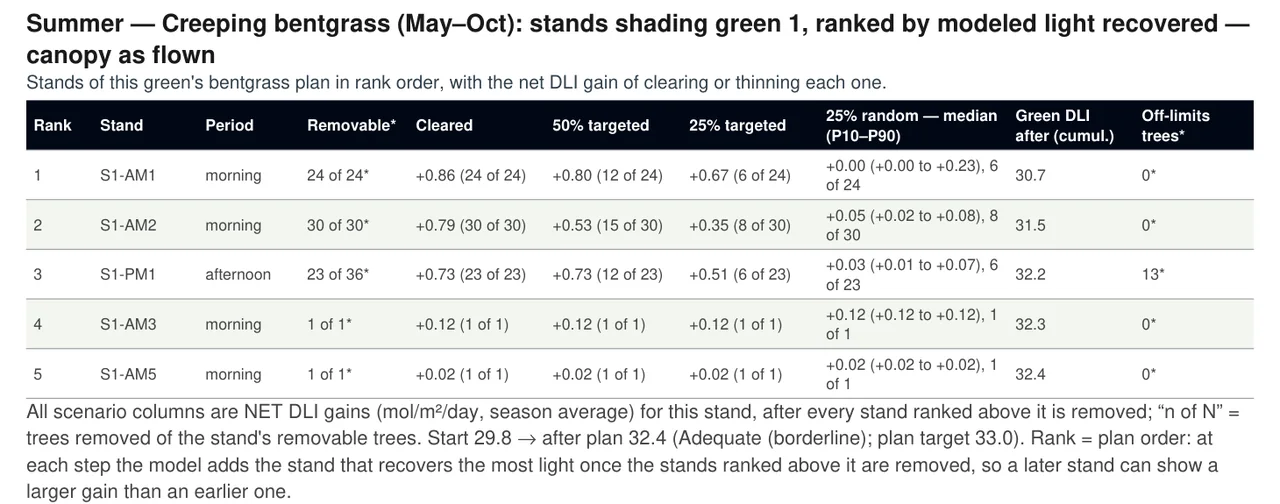
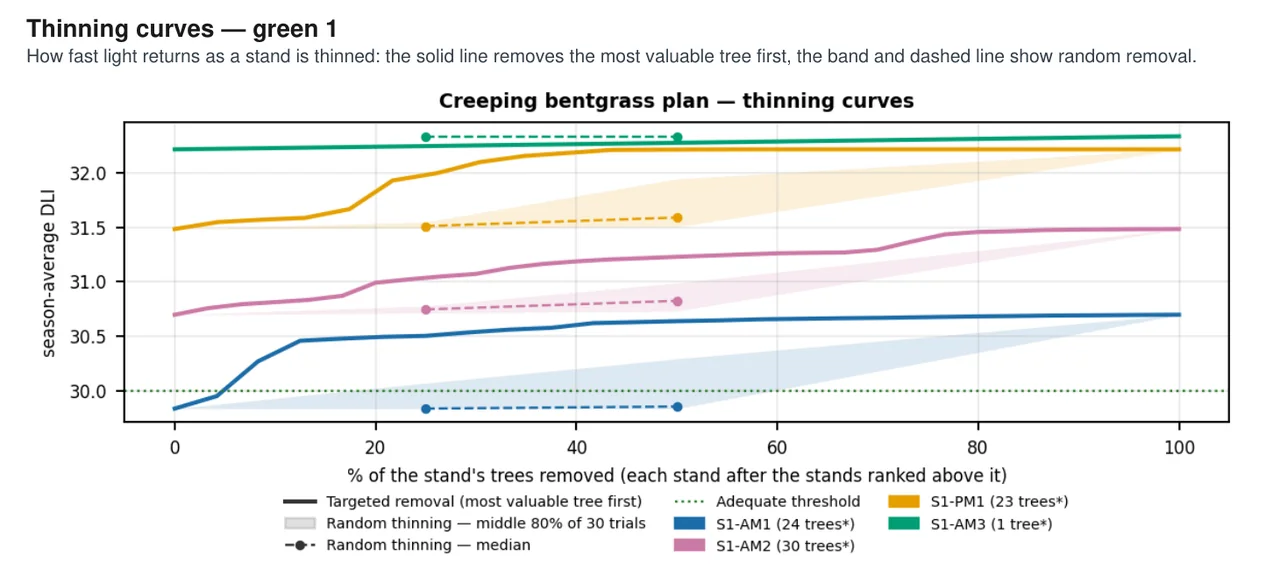
From one survey flight to a decision you can explain.
Survey flight
We fly the whole course by drone and build a 3D model of the ground and the tree canopy.
Light model
We trace the sun's path across that model through the seasons and estimate the daily light integral each green receives.
Ratings and rankings
Each green is rated for your grass, and the trees shading it are ranked by the light they cost it.
Your decision
You, your arborist and your agronomist decide what to do. The report gives you the numbers to explain it.
Questions about shade and light analysis
What is a shade analysis for a golf course?
A shade analysis for a golf course is a model of how much light each green gets through the seasons, built from a drone survey of the course and its trees. It shows which greens fall short for your grass and which trees cost them the most light.
Is the light measured on the greens?
No. In a shade analysis the course and its trees are mapped from the drone survey, and the light is modeled from that map using the sun's path. It is an estimate for comparing greens and trees, not a sensor reading.
Does the report tell us which trees to clear?
No. The shade analysis ranks the trees by how much light they cost each green. The decision belongs to the course, its arborist and its agronomist.
What won't the shade analysis tell me?
The shade analysis ranks greens and trees by modeled light; it does not recommend clearing or thinning anything, and it is not a survey of the course. The light is modeled from the drone survey, not read by a sensor, and the air-movement rating is descriptive. Decisions about trees and turf rest with the course, its arborist and its agronomist.
What is the daily light integral?
The daily light integral (DLI) is the total light a surface receives in a day. The shade analysis estimates it for each green and compares it with what your grass needs.
What does the air-movement rating mean?
The air-movement rating is a descriptive rating of how closed-in each green is by trees. It is modeled from the tree canopy, not a measured airflow or a research threshold.